++ ++
GeoZL

Python API

Measure, pick, run.

The high-level API has four calls.

profile ranks recipes for a tile.

graph builds a reusable graph.

compress returns a frame.

decompress returns flat bytes.

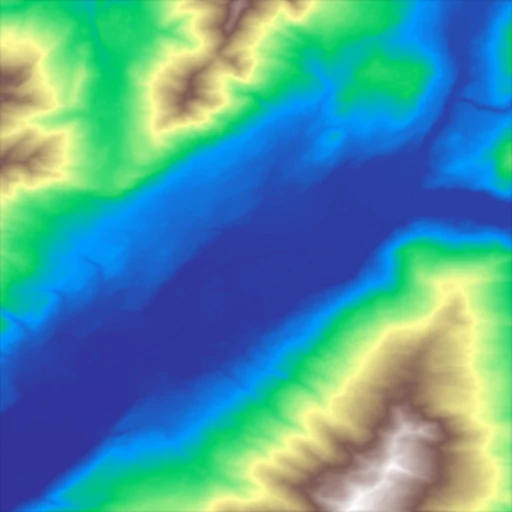
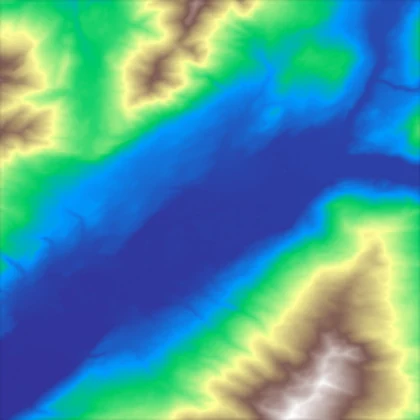
A 512 by 512 elevation tile over the Mont Blanc massif, a valley running diagonally between two ridges.
GLO‑30 · N45 E006 · 512² ~290 m ~2 280 m

the Python API

one workflow

One tile selects the pipeline. Every matching tile reuses it.

signature profile(tile, *, prior="planar", width=None, planes=None, error=None, reps=5, nodata=None, verify=False) → list[dict]

priorstr · NonePredictor filter. None tries all; "none" disables prediction.
widthint · NoneRow length; defaults to tile.shape[-1].
planesint · NoneStack count; defaults to B for (B, Y, X).
repsintTimed runs per recipe.
errorstr · NoneLossy recipe passed to graph.
nodatascalar · NoneMissing-value sentinel.
→ rowdictRecipe, size, ratio and throughput; sorted by ratio.

load the raster

Load one representative tile.Read a 512 × 512 DEM window and cast it to int16.
python · load a 512 × 512 tile
import numpy as np
import rasterio
from rasterio.windows import Window
import geozl

url = "https://copernicus-dem-30m.s3.amazonaws.com/Copernicus_DSM_COG_10_N45_00_E006_00_DEM/Copernicus_DSM_COG_10_N45_00_E006_00_DEM.tif"

with rasterio.open(url) as src:
    tile = src.read(
        1, window=Window(1000, 1000, 512, 512)
    ).round().astype(np.int16)

raw = tile.nbytes
(512, 512) int16 0.52 MB
Elevation tile from the Mont Blanc massif
Mont Blanc massifGLO-30 · 512²
sourceGLO‑30 COG
shape512 × 512
as int16524.3 kB

the graph model

A graph is a reusable codec pipeline. profile finds a recipe; graph builds it unchanged.

A GeoZL recipe as a directed codec graph A raster branches across predictor, layout and backend choices. The highlighted path is planar, zigzag, transpose and entropy, producing a self-describing frame. input predictor map layout backend output raster tileint16 planar delta_n identity zigzag transpose direct entropy zstd field_lz frameself-describing

Recipes are lossless unless error adds quantisation before the predictor.

profile the selection step

profile benchmarks every valid recipe on one representative tile and ranks them by ratio.

Run it once. Pick from the Pareto front: the smallest frame is not always the fastest decode.

python · benchmark one representative tile
rows = geozl.profile(
    tile, prior=None, reps=5
)
best = rows[0]["graph"]
planar>zigzag>transpose>entropy 4.50×
compression ratio vs decode speed 48 candidateshover a square pareto front dominated
2.0× 3.0× 4.0× 500 1000 1500 2000 ↑ ratio decode MB/s →

graph and compress the production step

profile chooses once; graph builds once; compress runs for every tile.

profile once, build once, compress every tile same data family

oncesample tileRepresentative.
onceprofileRanks recipes.
oncegraphBuilds the winner.
per tilecompressRuns the pipeline.
per tileframeDeterministic bytes.
python · choose once, build once, run many times
best = geozl.profile(tile, prior=None)[0]["graph"]
g = geozl.graph(tile, best)

for tile in tiles:
    frame = geozl.compress(tile, graph=g)
524.3 kB → 116.5 kB 4.50×

error bounded-error compression

error trades exact values for a smaller frame under an explicit per-sample bound. None stays lossless.

Build from data spanning the product; later tiles outside that domain are rejected.

linear · elevation|x − x̂| ≤ V log · SAR backscatter|x − x̂| ≤ P% of x sqrt · optical radiance|x − x̂| ≤ V·σ(x), σ² = a + b·x

SQRT: fit noise once with geozl.lossy.fit_noise(stack), then reuse a and b across tiles.

frame size vs. allowed error
25 50 75 100 0.5 1 2 4 8 16 32 64 ↑ frame kB error, metres → lossless · 116.5 kB 1
1knee8.81×±2.5 m · 59.5 kB · half the lossless frame.

decompress get the array back

decompress(frame) verifies the self-describing frame and returns flat uint8.

Restore dtype and shape with .view and .reshape. Lossless frames round-trip exactly; lossy frames respect their bound.

python · restore the raster
back = geozl.decompress(frame)
back = back.view("int16").reshape(512, 512)
(512, 512) int16

complete workflow measure, pick, run, restore

python
rows = geozl.profile(tile, prior=None)
best = rows[0]["graph"]

g = geozl.graph(tile, best, error="LINEAR:MAX_ERROR=4")
frame = geozl.compress(tile, graph=g)
back = geozl.decompress(frame).view("int16").reshape(512, 512)
9.93× 0.05 MB max error 4 m
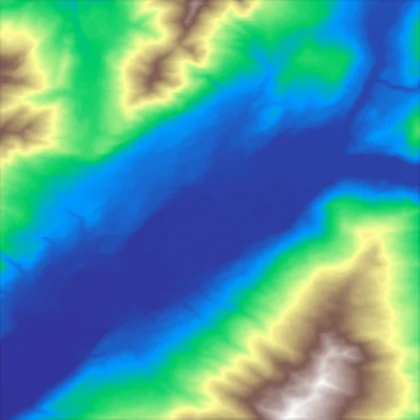
The original elevation tile.
original
The tile reconstructed after a lossy round trip, visually identical to the original.
reconstructed
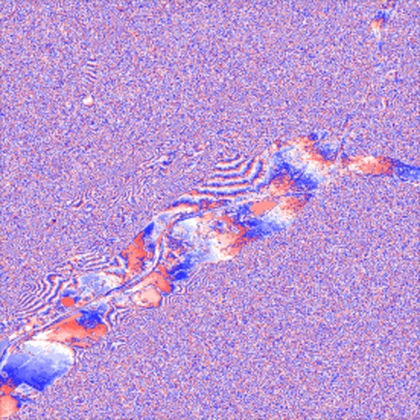
The difference between the two, mostly quantisation noise with structure along the valley floor and the ridges.
error · stretched to ±5 m

Reconstruction looks unchanged; the error view is amplified to ±5 m.